
Written by: Justin Choi (@justinochoi)
Follow us on Twitter! @Prospects365
“How’s Mike Trout doing?” is a question nobody asks, simply because it feels unnecessary to check up on Earth’s reigning slugger. Sure, there’s no harm in asking, but you’d feel like an idiot after the answer arrives: “10 home runs in 28 games!” It’s a given that Trout is doing well – he’s immune to slumps, and even when there’s a dip in production, his lows are the career highs of some.
Still, being the skeptical analyst I am, I decided to check up on Mike Trout. The easy answer: he’s doing fine! As of writing this article, his triple slash of .255/.333/.564 adds up to a 138 wRC+, which is down a notch from what he’s averaged the past seven years but fantastic nonetheless. In addition, rolling average graphs show he’s had a few 28-game stretches of around 140 wRC+. So there’s nothing left to examine – just a minor slump. Right?
Well, there is one oddity within Trout’s production. It’s a minor one, admittedly, that could be corrected by the end of the season. But I like to focus on the present, and right now it’s clear Trout is unlike his former self.
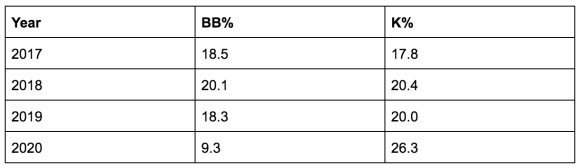
Consider not only the decrease in AVG and OBP, but also the difference between them – a gap that was once an ocean is now merely a gulf. The explanation behind the shrinkage is simple: Mike Trout is walking less and striking out more. Starting from 2017, which is when he kicked into another gear, here’s a table showing his strikeout and walk rates each year:
Answering what factors are fueling a reversal of years of consistency is a more difficult problem. For example, you might assume that Trout is either swinging at more pitches outside the zone, or just whiffing more in general. Per Fangraphs, however, his O-Swing% of 14.9% is the lowest of his career so far; his SwStr% of 7.0% is just a sliver higher than his career rate of 6.8%.
So what’s different about Trout? We’ll get to that soon, but first it’s important to know that pitchers have changed their approach towards him. More than ever before, they have been willing to offer Trout strikes:

A few theories float around as to why – one is that because Anthony Rendon now bats behind Trout, there’s less incentive to pitch around. Or perhaps because even when pitchers avoid the zone, Trout manages to crush their pitches anyway. To wit, his wOBAcon on pitches outside the zone last year was .451, dramatically higher than the league-average of .293. And when doesn’t make contact? Walks. Lots of walks.
There has never been a good way to pitch to Trout, but it seems like pitchers have calculated the risks and decided they’re better off challenging him, no matter how marginally better their payoffs are.
So far, it’s been working. Despite being offered more hittable pitches, Trout has decreased his swing rate. Here’s the same graph from above, this time with Z-Swing% included:

Both Zone% and Z-Swing% have fluctuated throughout the years, but never before has there been a convergence between these two metrics. Note how in between 2017 and 2018, Trout’s Z-Swing% mirrors the increases and decreases in his Zone%, a sign that he adjusted to how he was being pitched to. In 2020, Trout has not been as quick to react.
But is this a bad change? After all, his batted ball profile has not taken a hit, as Trout still ranks in the top percentile of most Statcast rankings. One could argue both ways, which is why the title is worded as a question. Let’s start off with the potential issues surrounding Trout’s newfound passivity: there’s a direct correlation with it and his rising strikeout rate.
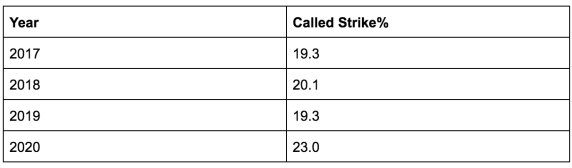
Swinging less while seeing more strikes means, well, more strikes – the common sense adds up. At first, it doesn’t look like Trout is letting strikes go enough to raise concern. Look, the percentages have shifted only by a few points compared to the last few years:
Dig deeper, however, and we begin to see the root of the problem. Taking strikes isn’t inherently bad – in fact, doing so is the first step to drawing walks – but it’s when a hitter does so that makes a difference. When you’re ahead in the count, an additional strike isn’t as unfavorable; there’s still room to breathe. The transition from 2-0 to 2-1 isn’t too scary; Trout’s wOBA actually increased in 2019 when that happened.
But when you’re behind? Another strike may very well equal an out. Unfortunately, Trout has been doing the opposite of what’s optimal, and by definition what he always did:

The percentages don’t add up to 100 because Savant defines a 3-2 count as both an ‘ahead’ and ‘even’ count, but I digress. We can’t attribute these changes solely to Trout just yet, though. It could be that opposing pitchers are avoiding the zone when he’s ahead, then ramping up the aggression when he falls behind.
That would soothe the part of me saying this is nothing to fret over, but the percentages suggest otherwise:

So Trout’s climbing Zone% is largely explained by the increase in strikes thrown to him when he’s ahead, yet his called strike rate in those situations has decreased? Holy contradiction batman! This confused me at first, but the answer is straightforward – Trout has not only decreased his overall Z-Swing%, but also reversed when those swings occur:

Granted, being aggressive when you’re ahead and passive when you aren’t doesn’t correlate with negative results – look no further than Tatis Jr.’s glorious 3-0 grand slam. But in Trout’s case, as explained earlier, this is a deviation from the approach that’s made him so successful. Staring down the barrel of a gun, Trout is becoming less likely to defend himself.
Maybe you’re not a fan of percentages, so how about some actual results? In 2019, Mike Trout struck out 119 times, 40 of which were a looking strikeout. That gives us a LSO percentage of 33.6% (oops, I used another percentage, but bear with me). A month into the 2020 season, he has struck out 31 times, a whopping 16 of which were an LSO. Do the math, and you get 51.6%, a mark Trout has never even come close to reaching.
In fact, the seemingly uncharacteristic jump in LSO is what prompted this deep dive of Mike Trout. Here’s an example of one, against Kenley Jansen that took many by surprise:
And another:
C’mon Mike Nelson Trout, you should be crushing a pitch like this!:
To summarize: pitchers are throwing more strikes to Mike Trout, who in turn is swinging at fewer of them. This in itself isn’t necessarily bad, but Trout’s aggression when he’s ahead as opposed to when he’s behind may be costing him potential walks. Furthermore, even after Trout falls behind, he’s been less willing to pull the trigger.
Trout’s offensive production is buoyed by his elite power – those early swings do result in home runs, after all – but as his current triple slash shows, power alone can’t make up for a flawed approach at the plate. The question is not if being too patient; rather, it’s a matter of when he’s being patient.
Ill-timed patience isn’t the only reason why Trout is struggling by his standards; rolling averages show us that his Z-Contact rate is the lowest it’s been since 2017. There’s a lot we can speculate about, but little to declare with certainty. All I know is that Trout so far, at least when we look at his swing tendencies, is in uncharted territory.
If he was a different hitter I’d end on a more cautious note, but c’mon – it’s Mike Trout. The greatest hitter of his generation has addressed weaknesses in his game plenty of times before. As proof, two days ago Fabian Ardaya of the Athletic reported that he’s been working on improving his outfield jump thanks to a thread on Twitter. Not saying he also needs this article, but… fine, I admit it, it’d be awesome if he came across it. Fingers crossed?
Follow us on Twitter! @Prospects365
Follow P365 MLB and KBO Analyst Justin Choi on Twitter! @justinochoi
All statistics from Baseball Savant and Fangraphs
Featured image courtesy of photographer Marcio Jose Sanchez and the Associated Press