Written by: Ethan Moore (@Moore_Stats)
Follow us on Twitter! @Prospects365
On August 8th, 2019, something strange occurred to me after watching this pitch. Check it out and maybe you’ll notice what I did.
What’s so weird about this pitch? For me, it was Strahm’s reaction. How could you strike out Nolan Arenado and be pissed? That’s a career highlight! But more interestingly, how could both players be mad after a single pitch? It seemed odd to me that the winner of an at bat could be mad about the result.
In this case, baseball fans probably understand that Arenado is frustrated because he struck out on a hittable pitch and Strahm is mad because he didn’t execute the pitch the way he wanted to. Arenado feels like his missed an opportunity to do damage and Strahm feels like he got away with one that he shouldn’t have. We understand this inherently as baseball watchers, but I want to dive deeper into what circumstances cause such counterintuitive behavior.
When a pitcher throws a great pitch and it gets a whiff, the hitter tips his cap. Good pitch. When a pitcher throws a bad pitch and it gets hit to the moon, that’s what was supposed to happen! Nothing out of the ordinary. When the pitcher throws a great pitch and the hitter finds a way to turn it into a hit? That’s baseball at it’s best. And when the pitcher fails to execute and the hitter fails to capitalize, that’s a Strahm/Arenado situation. Everybody is pissed.
The way I see it, most pitches can be categorized into one of these these four situations:

A hitter’s pitch is one that a hitter should do well against. A pitcher’s pitch is one that a hitter should not do well against. To put it more concretely, these categories could be thought of as:

According to this organization of pitches, all hitter success can be categorized as having come on either a hitter’s pitch or a pitcher’s pitch.
So my question is simple: Could a player go his entire career gaining most of his production against hitter’s pitches? Put another way, are there good Major Leaguers who can’t hit good pitching?
My theory is that good hitters hit hitter’s pitches but great hitters can also hit pitcher’s pitches. Let’s get into it.
Methodology
To start, I assessed each pitch by its linear weight value (what actually happened on the pitch) and its expected run value (an estimate of what should have happened on the pitch) detailed in my pitch quality article. If a pitch outcome was above the average linear weight, it was deemed to be a hitter success. Otherwise it was a hitter failure. If a pitch was above the mean expected run value, it was deemed to have been a hitter’s pitch. Otherwise, it was a pitcher’s pitch. Simple, but useful in my opinion.
Doing this, I was able to put every pitch from 2019 into one of the four categories from the charts above. Here are their relative frequencies:
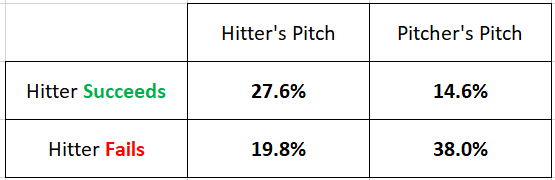
So about two-thirds of pitches in 2019 went the way we would have expected.
Breakdown
In the following graphs, the red points are the player’s production against pitcher’s pitches and the green points are the player’s production against hitter’s pitches. Everything left of the vertical line is negative production and the sum of the red and green points are the player’s total linear weight run value for 2019.
Also, I want to clarify that these values take every pitch into account, not just balls in play. A player may accrue positive value against pitcher’s pitches or hitter’s pitches simply by taking them for balls for example.
Let’s start with the basics. Who produced the most runs in 2019 against hitter’s pitches?

Surprisingly, Trevor Story! He outproduced every player in the league at the plate against bad pitches by putting up 53.6 runs worth of linear weight by making good swing decisions and doing damage on balls put in play. But as you see, he suffered against pitcher’s pitches. I’ll come back to that.
Some of Story’s companions at the top of the “Meatball Mashers” leaderboard (Bregman, Yelich, and Trout) did incredibly well against hitter’s pitches but also put up positive offensive totals against pitcher’s pitches (as you can see by their red dots being greater than the 0 line). That’s the difference between a good hitter and a great hitter. Elite hitters can hit all pitches, as this graph shows. How many other hitters were able to produce positive output against pitcher’s pitches? Not many.

This is an absolutely elite club of the game’s best hitters, so it’s no wonder the Rays traded for Randy Arozarena in January as he is clearly the game’s next mega-star. Jokes aside, the players on this list with a sufficient amount of playing time are some of the best hitters in the game and I don’t think that’s a coincidence. These are the hitters who can hit hitter’s pitches and pitcher’s pitches.
In contrast, who are the guys who did the worst against pitcher’s pitches?

This seems about right, doesn’t it?
The Answer
These are cool, but let’s answer the main question and wrap this up. Who in 2019 generated most of their production on pitches in the top left box and the least on pitches in the bottom left box? The money graph:

Trevor Story again! The master of the meatball is otherwise merely mortal. The list is a combination of power hitters and just plain not very productive hitters. My theory about what these players have in common is that they may have somewhat of an “all or nothing” approach. Against mistake pitches, they’re doing damage. But against good pitches, that approach just may not work the same. Also, these players probably make poor swing decisions and chase pitches they shouldn’t further decreasing their production against pitcher’s pitches.
Takeaways
The main upshot here is that Ethan learned how to make dumbbell graphs and went ham. But the secondary takeaway is that there is an important split that characterizes offensive profiles and separates good hitters from great hitters that has been ignored in the public sector. We know all about which players hit better against righties than lefties, better against fastballs than breaking balls, or better against the Orioles than the rest of the universe. It’s a bit crazy that until now, we didn’t know who can hit a pitcher’s pitch.
I see potential for this split to be used for informing platoon decisions where a bench player who hits hitter’s pitches well can be played more often against starters with poor pitch quality and a guy like Howie Kendrick (disproportionately good against pitcher’s pitches) could be played more against tough starters. Additionally, coaches could use this split to inform their training methods for a hitter. A guy who can’t hit pitcher’s pitches may need more game-like reps whereas a guy who is struggling to hit hitter’s pitches may have an approach problem to be ironed out (thinking too much in the box, for example).
Splits can help us understand when hitters are most comfortable and confident or help us diagnose an issue with a hitter’s approach. I see no reason why we shouldn’t embrace this new split that indicates how much of a player’s contribution comes from hitting bad pitching versus good pitching. Further research is necessary to find out if this split is stable or predictive, but there’s some promise here for teams to give another dimension to their player evaluation, advanced scouting, and player development systems.

I have made the data I used for this project available here if you want to play around with it.
Shouts out to the geom_dumbbell() function in the ggalt package that made this post possible.
Follow P365 Data Analyst Ethan Moore on Twitter! @Moore_Stats
Follow us on Twitter! @Prospects365